
Auditing Login Events with Service Broker
Perhaps one of the most important aspects of running a secure SQL Server is auditing login events – essentially capturing who’s logging in, and who’s attempting to login. Being aware of who’s logging in, and who’s trying to login, can help troubleshoot a variety of problems.

Tintoretto, Finding the body of St. Mark
SQL Server provides a couple of built-in methods for auditing login events, both successful attempts, and failed ones.
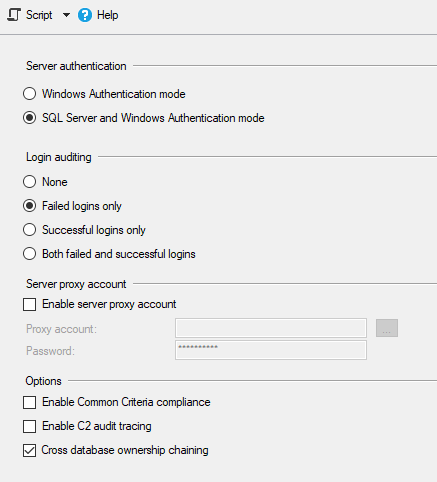
- Logging those records to the SQL Server Error Log, via the Server Properties dialog box. To get there, right-click the server name in the Object Explorer inside SQL Server Management Studio, and open the Security tab, where you’ll find a section for Login Auditing:
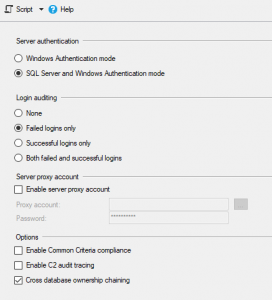
Server Properties Dialog Box showing Security Tab
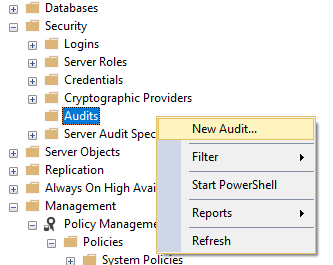
- Security Audits, via the Security -> Audits -> New Audit… menu in SQL Server Management Studio. This option allows you to log events into the Windows Security Event log or a binary .EVT file. See Microsoft’s Docs website for details.
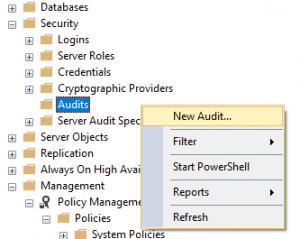
New Audit menu in SQL Server Management Studio
Logging to the SQL Server Error Log or the Windows Security Event Log means you’ll need some kind of tool to slice-and-dice the data, postmortem. It’s difficult to respond to events as they happen with this kind of auditing, and hard to create simple T-SQL queries to inspect the data. You could create a login trigger at the server level, but that will only allow you to capture successful logins. Coding the trigger incorrectly can result in everyone being locked out of the server. You’ll need to use the Dedicated Administrator Connection, otherwise known as the DAC, to login to the server and disable the errant trigger. Not fun.
Luckily, there is a much better option; using SQL Server’s built-in Event Notification service to receive login events through Service Broker. This event stream is asynchronous to the login process, meaning it won’t interrupt or slow down the login process, and it allows you to capture both successful and failed logins to a table, either locally or remotely. For larger SQL Server infrastructures, it’s not uncommon to setup a single SQL Server instance to gather this information for central analysis.
This blog post shows how to setup a database locally for auditing login events via SQL Server Event Notifications and Service Broker.
Setup the Database, First!
First, we need to create a database to store the login data. I like this in a separate database so you can manage this data effectively.
|
1 2 3 4 5 6 7 8 9 10 11 12 13 14 15 16 17 18 19 |
USE master; IF DB_ID(N'login_auditing') IS NULL BEGIN CREATE DATABASE login_auditing; ALTER DATABASE login_auditing MODIFY FILE (NAME = N'login_auditing', SIZE = 100MB, MAXSIZE = 1000MB, FILEGROWTH = 100MB); ALTER DATABASE login_auditing MODIFY FILE (NAME = N'login_auditing_log', SIZE = 100MB, MAXSIZE = 1000MB, FILEGROWTH = 100MB); ALTER DATABASE login_auditing SET ENABLE_BROKER; ALTER DATABASE login_auditing SET RECOVERY SIMPLE; BACKUP DATABASE login_auditing TO DISK = N'NUL:'; END GO |
The code above creates the login_auditing database in the default location for databases. You’ve configured this correctly on your instance, right? You could modify the statements above to point the data and log files to locations of your choosing, but I’ll leave that as an exercise for the reader. Service Broker is enabled in the database via the ALTER DATABASE ... SET ENABLE_BROKER; statement. We’re setting the recovery model to simple since we don’t really care about restoring this database with point-in-time recovery. Even if we lost the entire database, it wouldn’t be the end-of-the world, unless you’re required to audit logins by some law or regulation. In that case, you might want to enable full recovery, and take backups to allow you to meet your Recovery Point and Recovery Time objectives. The last statement takes a backup of the database to the NUL: device to ensure the recovery model change has taken effect. It’s just a habit I have.
The following code sets up several tables we’ll use to capture login details:
|
1 2 3 4 5 6 7 8 9 10 11 12 13 14 15 16 17 18 19 20 21 22 23 24 25 26 27 28 29 30 31 32 33 34 35 36 37 38 39 40 41 42 43 44 45 46 47 48 49 50 51 52 53 54 55 56 57 58 59 60 61 62 63 64 65 66 67 68 69 70 71 72 73 74 75 76 77 78 79 80 81 82 83 84 85 86 87 88 89 90 91 92 93 94 95 96 97 98 99 100 101 102 103 104 105 106 107 108 109 110 111 112 113 114 115 116 117 118 119 120 121 122 123 124 125 126 127 128 129 130 131 132 133 134 135 136 137 138 139 140 141 142 143 144 145 146 147 148 149 150 151 152 153 154 155 156 157 158 159 160 161 162 163 164 165 166 167 168 169 170 171 172 173 174 175 176 177 178 179 180 181 182 183 184 185 186 187 188 189 190 191 192 193 194 195 196 197 198 199 200 201 202 203 204 205 206 207 208 209 210 211 212 213 214 215 216 217 218 219 220 221 222 223 224 225 226 227 228 229 230 231 232 233 234 235 236 237 238 239 240 241 242 243 244 245 246 247 248 249 250 251 252 253 254 255 256 257 258 259 260 261 262 263 264 265 266 267 268 269 270 271 272 273 |
USE login_auditing; IF OBJECT_ID(N'dbo.failed_logins', N'U') IS NOT NULL BEGIN DROP TABLE dbo.failed_logins; END IF OBJECT_ID(N'dbo.audit_logins', N'U') IS NOT NULL BEGIN DROP TABLE dbo.audit_logins; END IF OBJECT_ID(N'dbo.applications', N'U') IS NOT NULL BEGIN DROP TABLE dbo.applications; END IF OBJECT_ID(N'dbo.login_names', N'U') IS NOT NULL BEGIN DROP TABLE dbo.login_names; END IF OBJECT_ID(N'dbo.[databases]', N'U') IS NOT NULL BEGIN DROP TABLE dbo.[databases]; END IF OBJECT_ID(N'dbo.NT_domains', N'U') IS NOT NULL BEGIN DROP TABLE dbo.NT_domains; END IF OBJECT_ID(N'dbo.hosts', N'U') IS NOT NULL BEGIN DROP TABLE dbo.hosts; END CREATE TABLE dbo.NT_domains ( NT_domain_name nvarchar(128) NOT NULL , NT_domain_id int NOT NULL CONSTRAINT NT_domains_pk PRIMARY KEY NONCLUSTERED WITH ( DATA_COMPRESSION = PAGE , ALLOW_ROW_LOCKS = ON , ALLOW_PAGE_LOCKS = ON , PAD_INDEX = OFF , FILLFACTOR = 100 ) ON [DEFAULT] IDENTITY(-2147483648, 1) ); CREATE CLUSTERED INDEX NT_domains_cx ON dbo.NT_domains (NT_domain_name) WITH ( DATA_COMPRESSION = PAGE , ALLOW_ROW_LOCKS = ON , ALLOW_PAGE_LOCKS = ON , PAD_INDEX = OFF , FILLFACTOR = 98 ) ON [DEFAULT]; CREATE TABLE dbo.hosts ( [host_id] int NOT NULL CONSTRAINT hosts_pk PRIMARY KEY NONCLUSTERED WITH ( DATA_COMPRESSION = PAGE , ALLOW_ROW_LOCKS = ON , ALLOW_PAGE_LOCKS = ON , PAD_INDEX = OFF , FILLFACTOR = 100 ) IDENTITY(-2147483648, 1) , [host_name] nvarchar(128) NOT NULL ) ON [DEFAULT]; CREATE CLUSTERED INDEX hosts_cx ON dbo.hosts ([host_name]) WITH ( DATA_COMPRESSION = PAGE , ALLOW_ROW_LOCKS = ON , ALLOW_PAGE_LOCKS = ON , PAD_INDEX = OFF , FILLFACTOR = 98 ); CREATE TABLE dbo.applications ( application_id int NOT NULL CONSTRAINT applications_pk PRIMARY KEY NONCLUSTERED WITH ( DATA_COMPRESSION = PAGE , ALLOW_ROW_LOCKS = ON , ALLOW_PAGE_LOCKS = ON , PAD_INDEX = OFF , FILLFACTOR = 100 ) ON [DEFAULT] IDENTITY(-247483648, 1) , application_name nvarchar(128) NOT NULL ) ON [DEFAULT]; CREATE UNIQUE CLUSTERED INDEX applications_cx ON dbo.Applications (application_name) WITH ( DATA_COMPRESSION = PAGE , ALLOW_ROW_LOCKS = ON , ALLOW_PAGE_LOCKS = ON , PAD_INDEX = OFF , FILLFACTOR = 95 ) ON [DEFAULT]; CREATE TABLE dbo.login_names ( login_name_id int NOT NULL CONSTRAINT login_names_pk PRIMARY KEY NONCLUSTERED WITH ( DATA_COMPRESSION = PAGE , ALLOW_ROW_LOCKS = ON , ALLOW_PAGE_LOCKS = ON , PAD_INDEX = OFF , FILLFACTOR = 100 ) ON [DEFAULT] IDENTITY(-247483648, 1) , login_name nvarchar(128) NOT NULL ) ON [DEFAULT]; CREATE UNIQUE CLUSTERED INDEX login_names_cx ON dbo.login_names ([login_name]) WITH ( DATA_COMPRESSION = PAGE , ALLOW_ROW_LOCKS = ON , ALLOW_PAGE_LOCKS = ON , PAD_INDEX = OFF , FILLFACTOR = 98 ) ON [DEFAULT]; CREATE TABLE dbo.[databases] ( [database_id] int NOT NULL CONSTRAINT databases_pk PRIMARY KEY NONCLUSTERED WITH ( DATA_COMPRESSION = PAGE , ALLOW_ROW_LOCKS = ON , ALLOW_PAGE_LOCKS = ON , PAD_INDEX = OFF , FILLFACTOR = 100 ) ON [DEFAULT] IDENTITY(-2147483648, 1) , [database_name] nvarchar(128) NOT NULL ) ON [DEFAULT]; CREATE UNIQUE CLUSTERED INDEX databases_cx ON dbo.[databases] ([database_name]) WITH ( DATA_COMPRESSION = PAGE , ALLOW_ROW_LOCKS = ON , ALLOW_PAGE_LOCKS = ON , PAD_INDEX = OFF , FILLFACTOR = 98 ) ON [DEFAULT]; --record failed login details in dbo.failed_logins CREATE TABLE dbo.failed_logins ( failed_logins_id int NOT NULL CONSTRAINT failed_logins_pk PRIMARY KEY CLUSTERED WITH ( DATA_COMPRESSION = PAGE , ALLOW_ROW_LOCKS = ON , ALLOW_PAGE_LOCKS = ON , PAD_INDEX = ON , FILLFACTOR = 100 ) ON [DEFAULT] IDENTITY(-2147483648, 1) , [post_time] datetime NOT NULL , [start_time] datetime NOT NULL , [NT_domain_id] int NULL CONSTRAINT failed_logins_ntdomain_id_fk FOREIGN KEY REFERENCES dbo.NT_domains ([NT_domain_id]) , [NT_user_name_id] int NULL CONSTRAINT failed_logins_nt_user_name_fk FOREIGN KEY REFERENCES dbo.login_names ([login_name_id]) , [host_name_id] int NULL CONSTRAINT failed_logins_hostname_id_fk FOREIGN KEY REFERENCES dbo.hosts ([host_id]) , [application_name_id] int NULL CONSTRAINT failed_logins_application_name_fk FOREIGN KEY REFERENCES dbo.applications ([application_id]) , [session_login_name_id] int NULL CONSTRAINT failed_logins_session_login_name_fk FOREIGN KEY REFERENCES dbo.login_names ([login_name_id]) , [login_name_id] int NULL CONSTRAINT failed_logins_login_name_fk FOREIGN KEY REFERENCES dbo.login_names ([login_name_id]) , [database_id] int NULL CONSTRAINT failed_logins_database_fk FOREIGN KEY REFERENCES dbo.[databases] ([database_id]) , [text_data] nvarchar(1000) NULL ); --record successful logins in dbo.audit_logins CREATE TABLE dbo.audit_logins ( audit_logins_id int NOT NULL CONSTRAINT audit_logins_pk PRIMARY KEY CLUSTERED WITH ( DATA_COMPRESSION = PAGE , ALLOW_ROW_LOCKS = ON , ALLOW_PAGE_LOCKS = ON , PAD_INDEX = ON , FILLFACTOR = 100 ) ON [DEFAULT] IDENTITY(-2147483648, 1) , [post_time] datetime NOT NULL , [start_time] datetime NOT NULL , [NT_domain_id] int NULL CONSTRAINT audit_logins_ntdomain_id_fk FOREIGN KEY REFERENCES dbo.NT_domains ([NT_domain_id]) , [NT_user_name_id] int NULL CONSTRAINT audit_logins_nt_user_name_fk FOREIGN KEY REFERENCES dbo.login_names ([login_name_id]) , [host_name_id] int NULL CONSTRAINT audit_logins_hostname_id_fk FOREIGN KEY REFERENCES dbo.hosts ([host_id]) , [application_name_id] int NULL CONSTRAINT audit_logins_application_name_fk FOREIGN KEY REFERENCES dbo.applications ([application_id]) , [session_login_name_id] int NULL CONSTRAINT audit_logins_session_login_name_fk FOREIGN KEY REFERENCES dbo.login_names ([login_name_id]) , [login_name_id] int NULL CONSTRAINT audit_logins_login_name_fk FOREIGN KEY REFERENCES dbo.login_names ([login_name_id]) , [database_id] int NULL CONSTRAINT audit_logins_database_fk FOREIGN KEY REFERENCES dbo.[databases] ([database_id]) , [is_system] bit NOT NULL CONSTRAINT audit_logins_is_system_df DEFAULT ((0)) ); |
There are two discrete tables for auditing login events. This makes it easy to look at the failed attempts without needing to wade through the far larger list of successful logins. Having two tables also allows two different sets of statistics objects, customized for each table. Since we may be capturing a very large number of events (thanks, SharePoint!), having 400 histogram steps, instead of 200, might be A Good Thing™. I’m all about getting good performance. You can thank me later. 😉
Service Broker Infrastructure
This next bit of code creates the required Service Broker infrastructure. We need a QUEUE, a SERVICE, a ROUTE, and an EVENT NOTIFICATION. If the objects exist, this code will drop ’em first:
|
1 2 3 4 5 6 7 8 9 10 11 12 13 14 15 16 17 18 19 20 21 22 23 24 25 26 27 28 29 30 31 32 33 34 35 36 37 38 39 40 41 42 43 44 45 46 47 48 49 50 51 52 53 |
IF EXISTS ( SELECT 1 FROM sys.routes r WHERE r.name = N'login_audit_route' ) BEGIN DROP ROUTE login_audit_route; END IF EXISTS ( SELECT 1 FROM sys.services s WHERE s.name = N'login_audit_service' ) BEGIN DROP SERVICE login_audit_service; END IF EXISTS ( SELECT 1 FROM sys.service_queues sq INNER JOIN sys.schemas s ON sq.schema_id = s.schema_id WHERE s.name = N'dbo' AND sq.name = N'login_audit_queue' ) BEGIN DROP QUEUE dbo.login_audit_queue; END IF EXISTS ( SELECT 1 FROM sys.server_event_notifications en WHERE en.name = N'login_audit' ) BEGIN DROP EVENT NOTIFICATION login_audit ON SERVER; END GO CREATE QUEUE dbo.login_audit_queue; CREATE SERVICE login_audit_service ON QUEUE login_audit_queue ([http://schemas.microsoft.com/SQL/Notifications/PostEventNotification]); CREATE ROUTE login_audit_route WITH SERVICE_NAME = N'login_audit_service' , ADDRESS = N'local'; CREATE EVENT NOTIFICATION login_audit ON SERVER FOR AUDIT_LOGIN, AUDIT_LOGIN_FAILED TO SERVICE N'login_audit_service', N'current database'; GO |
Activation Stored Procedure
Next, we’ll need a stored procedure for Service Broker to call whenever it sends a message to the queue. This stored procedure parses the Event Notification XML data into discrete variables that are then inserted into the relevant tables:
|
1 2 3 4 5 6 7 8 9 10 11 12 13 14 15 16 17 18 19 20 21 22 23 24 25 26 27 28 29 30 31 32 33 34 35 36 37 38 39 40 41 42 43 44 45 46 47 48 49 50 51 52 53 54 55 56 57 58 59 60 61 62 63 64 65 66 67 68 69 70 71 72 73 74 75 76 77 78 79 80 81 82 83 84 85 86 87 88 89 90 91 92 93 94 95 96 97 98 99 100 101 102 103 104 105 106 107 108 109 110 111 112 113 114 115 116 117 118 119 120 121 122 123 124 125 126 127 128 129 130 131 132 133 134 135 136 137 138 139 140 141 142 143 144 145 146 147 148 149 150 151 152 153 154 155 156 157 158 159 160 161 162 163 164 165 166 167 168 169 170 171 172 173 174 175 176 177 178 179 180 181 182 183 184 185 186 187 188 189 190 191 192 193 194 195 196 197 198 199 200 201 202 203 204 205 206 207 208 209 210 211 212 213 214 215 216 217 218 219 220 221 222 223 224 225 226 227 228 229 230 231 232 233 234 235 236 237 238 239 240 241 242 243 244 245 246 247 248 249 250 251 252 253 254 255 256 257 258 259 260 261 262 263 264 265 266 267 268 269 270 271 272 273 274 275 276 277 278 279 280 281 282 283 284 285 286 287 288 289 290 291 292 293 294 295 296 297 298 299 300 301 302 303 304 305 306 307 308 309 310 311 312 313 314 315 316 317 318 319 320 321 322 323 324 325 326 327 328 329 330 331 332 333 334 335 336 337 338 339 340 341 342 343 344 345 346 347 348 349 350 351 352 353 354 355 356 357 358 359 360 361 362 363 364 365 366 367 368 369 370 371 372 373 374 375 376 377 378 379 380 381 382 383 384 385 386 387 388 389 390 391 392 393 394 395 396 397 398 399 400 401 402 403 404 405 406 407 408 409 410 411 412 413 414 415 416 417 418 419 420 421 422 423 424 425 426 427 428 429 430 431 432 433 434 435 436 437 438 439 440 441 442 443 444 445 446 447 448 449 450 451 452 453 454 455 456 457 458 459 460 461 462 463 464 465 466 467 468 469 470 471 472 473 |
IF OBJECT_ID(N'dbo.login_audit_receiver', N'P') IS NOT NULL BEGIN DROP PROCEDURE dbo.login_audit_receiver; END GO /* Uses SQL Server Event Notifications and Service Broker to audit both successful and failed logins. Failed Logins are logged into dbo.failed_logins. Successful Logins are logged into dbo.audit_logins. By: Hannah Vernon Date: 2020-01-22 Version History: 2020-01-22 Initial version. */ CREATE PROCEDURE dbo.login_audit_receiver AS BEGIN SET NOCOUNT ON; DECLARE @xml xml = NULL; DECLARE @message_type sysname = NULL; DECLARE @EventType sysname; DECLARE @PostTime datetime; DECLARE @StartTime datetime; DECLARE @Success bit; DECLARE @NTDomainName nvarchar(128); DECLARE @NTDomainID int; DECLARE @NTUserName varchar(128); DECLARE @HostName nvarchar(128); DECLARE @ApplicationName nvarchar(128); DECLARE @SessionLoginName nvarchar(128); DECLARE @LoginName nvarchar(128); DECLARE @DatabaseName nvarchar(128); DECLARE @TextData nvarchar(1000); DECLARE @NTUserNameID varchar(128); DECLARE @HostNameID nvarchar(128); DECLARE @ApplicationNameID nvarchar(128); DECLARE @SessionLoginNameID nvarchar(128); DECLARE @LoginNameID nvarchar(128); DECLARE @DatabaseNameID nvarchar(128); DECLARE @q TABLE ( [status] tinyint NOT NULL , [priority] tinyint NOT NULL , [queuing_order] bigint NOT NULL , [conversation_group_id] uniqueidentifier NOT NULL , [conversation_handle] uniqueidentifier NOT NULL , [message_sequence_number] bigint NOT NULL , [service_name] nvarchar(512) NOT NULL , [service_id] int NOT NULL , [service_contract_name] nvarchar(256) NOT NULL , [service_contract_id] int NOT NULL , [message_type_name] nvarchar(256) NOT NULL , [message_type_id] int NOT NULL , [validation] nchar(2) NOT NULL --E (Empty), N (None), X (XML) , [message_body] varbinary(max) ); DECLARE @NT_domains TABLE ( [NT_domain_id] int NOT NULL ); DECLARE @login_names TABLE ( [login_name_id] int NOT NULL ); DECLARE @hosts TABLE ( [host_id] int NOT NULL ); DECLARE @Applications TABLE ( application_id int NOT NULL ); DECLARE @SessionLoginNames TABLE ( session_login_name_id int NOT NULL ); DECLARE @LoginNames TABLE ( login_name_id int NOT NULL ); DECLARE @DatabaseNames TABLE ( [database_id] int NOT NULL ); /* Wait for and receive a message from the Service Broker queue, and save it into the @q table variable. We have no timeout here since Service Broker should be the only way this stored procedure runs, and only when there is a message in the queue. */ WAITFOR ( RECEIVE TOP (1) [status] , [priority] , [queuing_order] , [conversation_group_id] , [conversation_handle] , [message_sequence_number] , [service_name] , [service_id] , [service_contract_name] , [service_contract_id] , [message_type_name] , [message_type_id] , [validation] , [message_body] FROM dbo.login_audit_queue INTO @q ); /* If the queue message is an XML message, get the XML into the @xml variable. */ SELECT @xml = CASE WHEN lar.[validation] = N'X' THEN CONVERT(xml, lar.message_body) ELSE NULL END FROM @q lar; IF @xml IS NOT NULL BEGIN /* get the message type; either AUDIT_LOGIN or AUDIT_LOGIN_FAILED */ SET @message_type = @xml.value(N'(/EVENT_INSTANCE/EventType)[1]', N'sysname'); IF @message_type = N'AUDIT_LOGIN_FAILED' /* catch failed logins */ BEGIN /* Parse the XML into variables */ SELECT @EventType = @xml.value(N'(/EVENT_INSTANCE/EventType)[1]', N'sysname') , @PostTime = @xml.value(N'(/EVENT_INSTANCE/PostTime)[1]', N'datetime') , @StartTime = @xml.value(N'(/EVENT_INSTANCE/StartTime)[1]', N'datetime') , @Success = @xml.value(N'(/EVENT_INSTANCE/Success)[1]', N'int') , @NTDomainName = @xml.value(N'(/EVENT_INSTANCE/NTDomainName)[1]', N'nvarchar(128)') , @NTUserName = @xml.value(N'(/EVENT_INSTANCE/NTUserName)[1]', N'nvarchar(128)') , @HostName = @xml.value(N'(/EVENT_INSTANCE/HostName)[1]', N'nvarchar(128)') , @ApplicationName = @xml.value(N'(/EVENT_INSTANCE/ApplicationName)[1]', N'nvarchar(128)') , @SessionLoginName = @xml.value(N'(/EVENT_INSTANCE/SessionLoginName)[1]', N'nvarchar(128)') , @LoginName = @xml.value(N'(/EVENT_INSTANCE/LoginName)[1]', N'nvarchar(128)') , @DatabaseName = @xml.value(N'(/EVENT_INSTANCE/DatabaseName)[1]', N'nvarchar(128)') , @TextData = @xml.value(N'(/EVENT_INSTANCE/TextData)[1]', N'nvarchar(1000)'); /* In attempt to enforce the Do-Not-Repeat-Yourself mantra common in database design, we'll lookup the various values from above in the associated tables, getting the associate key value to use in the main table. Where a key does not exist, we'll add an entry to the associated table, and use the OUTPUT...INTO clause to get the newly created key. Yes, this is single-threaded, but since we're only dealing with a single value each time this proc gets called, and each table has its clustered index defined on the value, that won't be problematic since SQL Server will likely choose to do a clustered index seek to find the page where the new row should be inserted. */ IF @NTDomainName IS NOT NULL BEGIN SELECT @NTDomainID = ntd.[nt_domain_id] FROM dbo.[NT_domains] ntd WHERE ntd.[NT_domain_name] = @NTDomainName; IF @NTDomainID IS NULL BEGIN INSERT INTO dbo.[NT_domains] ([NT_domain_name]) OUTPUT inserted.[NT_domain_id] INTO @NT_domains VALUES (@NTDomainName) SELECT @NTDomainID = ntd.[NT_domain_id] FROM @NT_domains ntd; END END IF @NTUserName IS NOT NULL BEGIN SELECT @NTUserNameID = un.[login_name_id] FROM dbo.login_names un WHERE un.login_name = @NTUserName; IF @NTUserNameID IS NULL BEGIN INSERT INTO dbo.login_names ([login_name]) OUTPUT inserted.[login_name_id] INTO @login_names ([login_name_id]) VALUES (@NTUserName); SELECT @NTUserNameID = un.[login_name_id] FROM @login_names un; END END IF @HostName IS NOT NULL BEGIN SELECT @HostNameID = h.[host_id] FROM dbo.hosts h WHERE h.[host_name] = @HostName; IF @HostNameID IS NULL BEGIN INSERT INTO dbo.Hosts ([host_name]) OUTPUT inserted.[host_id] INTO @hosts ([host_id]) VALUES (@HostName); SELECT @HostNameID = h.[host_id] FROM @hosts h END END IF @ApplicationName IS NOT NULL BEGIN SELECT @ApplicationNameID = a.application_id FROM dbo.applications a WHERE a.application_name = @ApplicationName; IF @ApplicationNameID IS NULL BEGIN INSERT INTO dbo.applications ([application_name]) OUTPUT inserted.[application_id] INTO @Applications ([application_id]) VALUES (@ApplicationName); SELECT @ApplicationNameID = a.[application_id] FROM @Applications a; END END IF @SessionLoginName IS NOT NULL BEGIN SELECT @SessionLoginNameID = l.[login_name_id] FROM dbo.login_names l WHERE l.login_name = @SessionLoginName; IF @SessionLoginNameID IS NULL BEGIN INSERT INTO dbo.login_names ([login_name]) OUTPUT inserted.[login_name_id] INTO @SessionLoginNames ([session_login_name_id]) VALUES (@SessionLoginName); SELECT @SessionLoginNameID = s.session_login_name_id FROM @SessionLoginNames s; END END IF @LoginName IS NOT NULL BEGIN SELECT @LoginNameID = l.[login_name_id] FROM dbo.login_names l WHERE l.login_name = @LoginName; IF @LoginNameID IS NULL BEGIN INSERT INTO dbo.login_names ([login_name]) OUTPUT inserted.[login_name_id] INTO @LoginNames ([login_name_id]) VALUES (@LoginName); SELECT @LoginNameID = s.login_name_id FROM @LoginNames s; END END IF @DatabaseName IS NOT NULL BEGIN SELECT @DatabaseNameID = d.[database_id] FROM dbo.databases d WHERE d.[database_name] = @DatabaseName; IF @DatabaseNameID IS NULL BEGIN INSERT INTO dbo.[databases] ([database_name]) OUTPUT inserted.[database_id] INTO @DatabaseNames ([database_id]) VALUES (@DatabaseName); SELECT @DatabaseNameID = d.[database_id] FROM @DatabaseNames d; END END INSERT INTO dbo.failed_logins ( [post_time] , [start_time] , [NT_domain_id] , [NT_user_name_id] , [host_name_id] , [application_name_id] , [session_login_name_id] , [login_name_id] , [database_id] , [text_data] ) VALUES ( @PostTime , @StartTime , @NTDomainID , @NTUserNameID , @HostNameID , @ApplicationNameID , @SessionLoginNameID , @LoginNameID , @DatabaseNameID , @TextData ); END ELSE IF @message_type = N'AUDIT_LOGIN' /* catch successful logins */ BEGIN SELECT @EventType = @xml.value(N'(/EVENT_INSTANCE/EventType)[1]', 'sysname') , @PostTime = @xml.value(N'(/EVENT_INSTANCE/PostTime)[1]', 'datetime') , @StartTime = @xml.value(N'(/EVENT_INSTANCE/StartTime)[1]', 'datetime') , @Success = @xml.value(N'(/EVENT_INSTANCE/Success)[1]', 'int') , @NTDomainName = @xml.value(N'(/EVENT_INSTANCE/NTDomainName)[1]', 'nvarchar(128)') , @NTUserName = @xml.value(N'(/EVENT_INSTANCE/NTUserName)[1]', 'nvarchar(128)') , @HostName = @xml.value(N'(/EVENT_INSTANCE/HostName)[1]', 'nvarchar(128)') , @ApplicationName = @xml.value(N'(/EVENT_INSTANCE/ApplicationName)[1]', 'nvarchar(128)') , @SessionLoginName = @xml.value(N'(/EVENT_INSTANCE/SessionLoginName)[1]', 'nvarchar(128)') , @LoginName = @xml.value(N'(/EVENT_INSTANCE/LoginName)[1]', 'nvarchar(128)') , @DatabaseName = @xml.value(N'(/EVENT_INSTANCE/DatabaseName)[1]', 'nvarchar(128)'); IF @NTDomainName IS NOT NULL BEGIN SELECT @NTDomainID = ntd.[nt_domain_id] FROM dbo.[NT_domains] ntd WHERE ntd.[NT_domain_name] = @NTDomainName; IF @NTDomainID IS NULL BEGIN INSERT INTO dbo.[NT_domains] ([NT_domain_name]) OUTPUT inserted.[NT_domain_id] INTO @NT_domains VALUES (@NTDomainName) SELECT @NTDomainID = ntd.[NT_domain_id] FROM @NT_domains ntd; END END IF @NTUserName IS NOT NULL BEGIN SELECT @NTUserNameID = un.[login_name_id] FROM dbo.login_names un WHERE un.login_name = @NTUserName; IF @NTUserNameID IS NULL BEGIN INSERT INTO dbo.login_names ([login_name]) OUTPUT inserted.[login_name_id] INTO @login_names ([login_name_id]) VALUES (@NTUserName); SELECT @NTUserNameID = un.[login_name_id] FROM @login_names un; END END IF @HostName IS NOT NULL BEGIN SELECT @HostNameID = h.[host_id] FROM dbo.hosts h WHERE h.[host_name] = @HostName; IF @HostNameID IS NULL BEGIN INSERT INTO dbo.Hosts ([host_name]) OUTPUT inserted.[host_id] INTO @hosts ([host_id]) VALUES (@HostName); SELECT @HostNameID = h.[host_id] FROM @hosts h END END IF @ApplicationName IS NOT NULL BEGIN SELECT @ApplicationNameID = a.application_id FROM dbo.applications a WHERE a.application_name = @ApplicationName; IF @ApplicationNameID IS NULL BEGIN INSERT INTO dbo.applications ([application_name]) OUTPUT inserted.[application_id] INTO @Applications ([application_id]) VALUES (@ApplicationName); SELECT @ApplicationNameID = a.[application_id] FROM @Applications a; END END IF @SessionLoginName IS NOT NULL BEGIN SELECT @SessionLoginNameID = l.[login_name_id] FROM dbo.login_names l WHERE l.login_name = @SessionLoginName; IF @SessionLoginNameID IS NULL BEGIN INSERT INTO dbo.login_names ([login_name]) OUTPUT inserted.[login_name_id] INTO @SessionLoginNames ([session_login_name_id]) VALUES (@SessionLoginName); SELECT @SessionLoginNameID = s.session_login_name_id FROM @SessionLoginNames s; END END IF @LoginName IS NOT NULL BEGIN SELECT @LoginNameID = l.[login_name_id] FROM dbo.login_names l WHERE l.login_name = @LoginName; IF @LoginNameID IS NULL BEGIN INSERT INTO dbo.login_names ([login_name]) OUTPUT inserted.[login_name_id] INTO @LoginNames ([login_name_id]) VALUES (@LoginName); SELECT @LoginNameID = s.login_name_id FROM @LoginNames s; END END IF @DatabaseName IS NOT NULL BEGIN SELECT @DatabaseNameID = d.[database_id] FROM dbo.databases d WHERE d.[database_name] = @DatabaseName; IF @DatabaseNameID IS NULL BEGIN INSERT INTO dbo.[databases] ([database_name]) OUTPUT inserted.[database_id] INTO @DatabaseNames ([database_id]) VALUES (@DatabaseName); SELECT @DatabaseNameID = d.[database_id] FROM @DatabaseNames d; END END INSERT INTO dbo.audit_logins ( [post_time] , [start_time] , [NT_domain_id] , [NT_user_name_id] , [host_name_id] , [application_name_id] , [session_login_name_id] , [login_name_id] , [database_id] ) VALUES ( @PostTime , @StartTime , @NTDomainID , @NTUserNameID , @HostNameID , @ApplicationNameID , @SessionLoginNameID , @LoginNameID , @DatabaseNameID ); END ELSE BEGIN /* This should never happen, but if we happen to get a poison message or something else, the error will be written to the SQL Server Event Log. */ DECLARE @msg nvarchar(1000); SET @msg = N'Invalid message type, ' + @message_type + N' found in login_audit_queue queue.!'; RAISERROR(@msg, 14, 0) WITH NOWAIT; END END END GO |
Finally, the following code configures the queue to call a maximum of 4 simulatenous readers, and activates the queue. I have RETENTION = OFF because I don’t want the queue to retain recorded events. I have MAX_QUEUE_READERS set to 4 on some busy instances; you may want to move this up or down depending on how busy your server is.
|
1 2 3 4 5 6 7 8 9 |
ALTER QUEUE dbo.login_audit_queue WITH ACTIVATION ( STATUS = ON --enables calling the activation procedure , PROCEDURE_NAME = login_auditing.dbo.login_audit_receiver , EXECUTE AS OWNER , MAX_QUEUE_READERS = 4 ) , RETENTION = OFF , STATUS = ON; --enables the queue itself |
Once you have the Event Notification and Service Broker infrastructure in place, both successful and failed logins will be logged.
If you need to turn the queue off for some reason, use the following code:
|
1 2 |
ALTER QUEUE dbo.login_audit_queue WITH STATUS = OFF; |
Analysis
Here’s a couple of sample queries to get you started. The first simply shows the last login date for the list of logins stored in sys.server_principals – you could use this to potentially disable logins that haven’t been used in x number of months, etc. The second and third queries show the details of successful logins and failed logins, respectively.
|
1 2 3 4 5 6 7 8 9 10 11 12 13 14 15 16 17 18 19 20 21 22 23 24 25 26 27 28 29 30 31 32 33 34 35 36 37 38 39 40 41 42 43 44 45 46 47 48 49 50 51 52 53 54 55 56 57 58 59 60 61 62 63 64 65 66 67 68 69 |
USE login_auditing; GO SET TRANSACTION ISOLATION LEVEL READ UNCOMMITTED; SET NOCOUNT ON; SELECT sp.name , last_login_date = al.most_recent_login_date , last_session_login_date = al.most_recent_login_date FROM master.sys.server_principals sp LEFT JOIN dbo.login_names ln ON sp.name = ln.login_name LEFT JOIN ( SELECT al.login_name_id, most_recent_login_date = MAX(al.start_time) FROM dbo.audit_logins al GROUP BY al.login_name_id ) al ON ln.login_name_id = al.login_name_id LEFT JOIN ( SELECT al.session_login_name_id, most_recent_login_date = MAX(al.start_time) FROM dbo.audit_logins al GROUP BY al.session_login_name_id ) als ON ln.login_name_id = als.session_login_name_id WHERE sp.[type_desc] IN ( N'SQL_LOGIN' , N'WINDOWS_LOGIN' , N'WINDOWS_GROUP' ) ORDER BY sp.name; SELECT al.audit_logins_id , al.post_time , al.start_time , a.application_name , h.[host_name] , domain_name = ntd.NT_domain_name , domain_login_name = lnt.login_name , session_login_name = lns.login_name , login_name = ln.login_name , [database_name] = d.database_name FROM dbo.audit_logins al LEFT JOIN dbo.applications a ON al.application_name_id = a.application_id LEFT JOIN dbo.[databases] d ON al.database_id = d.database_id LEFT JOIN dbo.NT_domains ntd ON al.NT_domain_id = ntd.NT_domain_id LEFT JOIN dbo.hosts h ON al.host_name_id = h.[host_id] LEFT JOIN dbo.login_names lnt ON al.NT_user_name_id = lnt.login_name_id LEFT JOIN dbo.login_names ln ON al.login_name_id = ln.login_name_id LEFT JOIN dbo.login_names lns ON al.session_login_name_id = lns.login_name_id ORDER BY al.post_time; SELECT al.failed_logins_id , al.post_time , al.start_time , a.application_name , h.[host_name] , domain_name = ntd.NT_domain_name , domain_login_name = lnt.login_name , session_login_name = lns.login_name , login_name = ln.login_name , [database_name] = d.database_name , al.text_data FROM dbo.failed_logins al LEFT JOIN dbo.applications a ON al.application_name_id = a.application_id LEFT JOIN dbo.[databases] d ON al.database_id = d.database_id LEFT JOIN dbo.NT_domains ntd ON al.NT_domain_id = ntd.NT_domain_id LEFT JOIN dbo.hosts h ON al.host_name_id = h.[host_id] LEFT JOIN dbo.login_names lnt ON al.NT_user_name_id = lnt.login_name_id LEFT JOIN dbo.login_names ln ON al.login_name_id = ln.login_name_id LEFT JOIN dbo.login_names lns ON al.session_login_name_id = lns.login_name_id ORDER BY al.post_time; |
Let me know if what you think of this methodology, or if you see some potential pitfall not covered herein.
See Service Broker Queue Monitor for code to create a console app for monitoring SQL Server Service Broker Queues.
Check out the rest of our security-related posts!
[…] Hannah Vernon takes us through using Service Broker to audit login events: […]