
Compare Plans with SSMS 2016+
Microsoft has been making great strides with their database management platform lately. One really great improvement in their management tool, SQL Server Management Studio, is the “Compare Plans” feature. This allows visually comparing plans to see how they vary.
As an example, take the following two queries, which SQL Server auto-parameterizes. Since both parameter values vary widely, SQL Server creates two different plans for what are, at first glance, the same query. Using the “Compare Plans” feature allows us to pretty quickly understand the details about why SQL Server has different plans for them:
|
1 2 3 |
SELECT * FROM dbo.OnDiskNumbers odn WHERE odn.Number > 9999; |
|
1 2 3 4 |
SELECT * FROM dbo.OnDiskNumbers odn WHERE odn.Number > 9999999; |
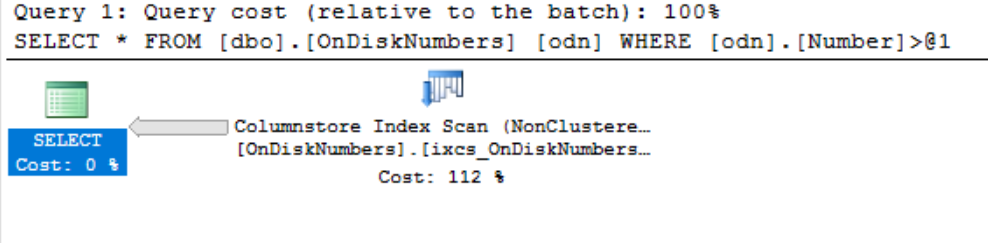
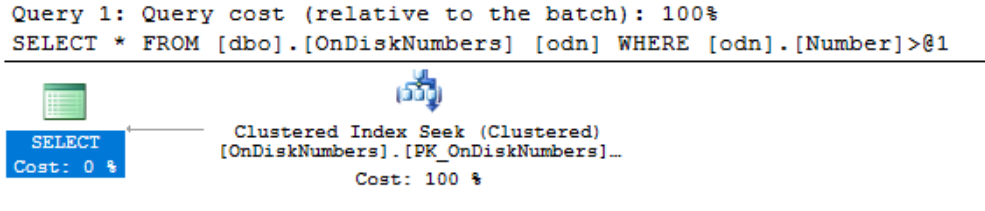
The actual execution plans for the two queries are:
The dbo.OnDiskNumbers table is a typical “numbers” table:
|
1 2 3 4 5 6 7 8 9 10 11 12 13 14 15 16 17 18 19 20 21 22 23 24 25 26 27 28 29 30 31 32 33 34 35 36 37 38 39 40 |
IF OBJECT_ID('dbo.OnDiskNumbers') IS NOT NULL DROP TABLE dbo.OnDiskNumbers; CREATE TABLE dbo.OnDiskNumbers ( Number int NOT NULL CONSTRAINT PK_OnDiskNumbers PRIMARY KEY CLUSTERED WITH ( DATA_COMPRESSION = PAGE , ALLOW_ROW_LOCKS = ON , ALLOW_PAGE_LOCKS = ON , FILLFACTOR = 100 , PAD_INDEX = OFF ) ) ON [PRIMARY]; CREATE NONCLUSTERED COLUMNSTORE INDEX ixcs_OnDiskNumbers ON dbo.OnDiskNumbers(Number) WITH ( DATA_COMPRESSION = COLUMNSTORE , COMPRESSION_DELAY = 1 MINUTE ) ON [PRIMARY]; ;WITH num AS ( SELECT * FROM (VALUES(0),(1),(2),(3),(4),(5),(6),(7),(8),(9))n(val) ) INSERT INTO dbo.OnDiskNumbers (Number) SELECT rn = ROW_NUMBER() OVER (ORDER BY n1.val) FROM num n1 CROSS JOIN num n2 CROSS JOIN num n3 CROSS JOIN num n4 CROSS JOIN num n5 CROSS JOIN num n6 CROSS JOIN num n7; |
The table has 10,000,000 rows. I’ve create a non-clustered columnstore index on the table, which I’ll talk about in a future post. I’ve included it here because it provides a succinct difference in the two plans.
To compare the plans visually, side-by-side, you need to save the first plan by right-clicking on the plan window, clicking “Save Execution Plan As…”, and specifying a filename. Next, right-click on the plan window, and choose “Compare Showplan”:

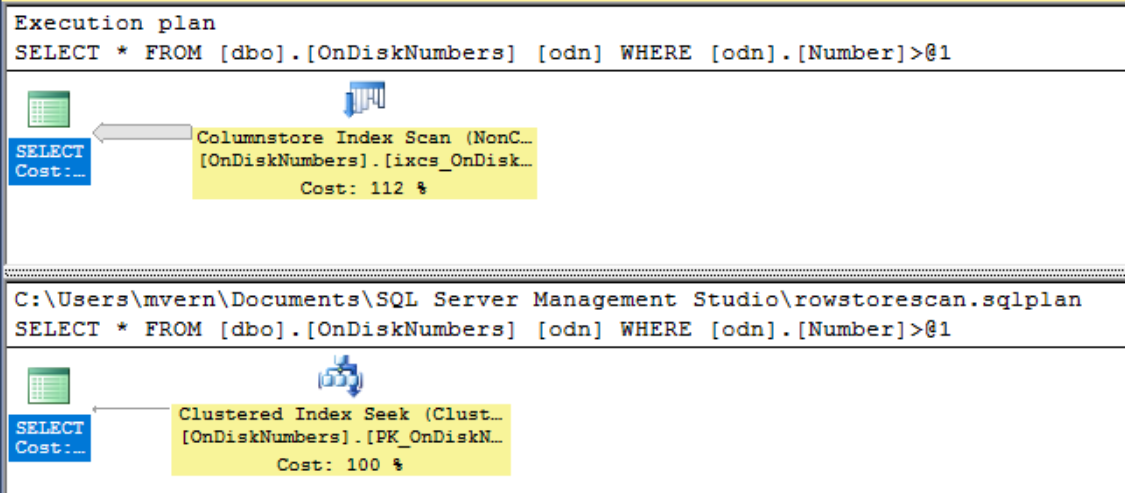
At this point, select the saved Execution Plan file you saved above, which will result in the Execution Plan window switching to the comparison view, which includes both graphical execution plans:
If you have the “Properties” window open, you can compare details about the plans, such as Actual Number of Rows, Memory Grants, etc:
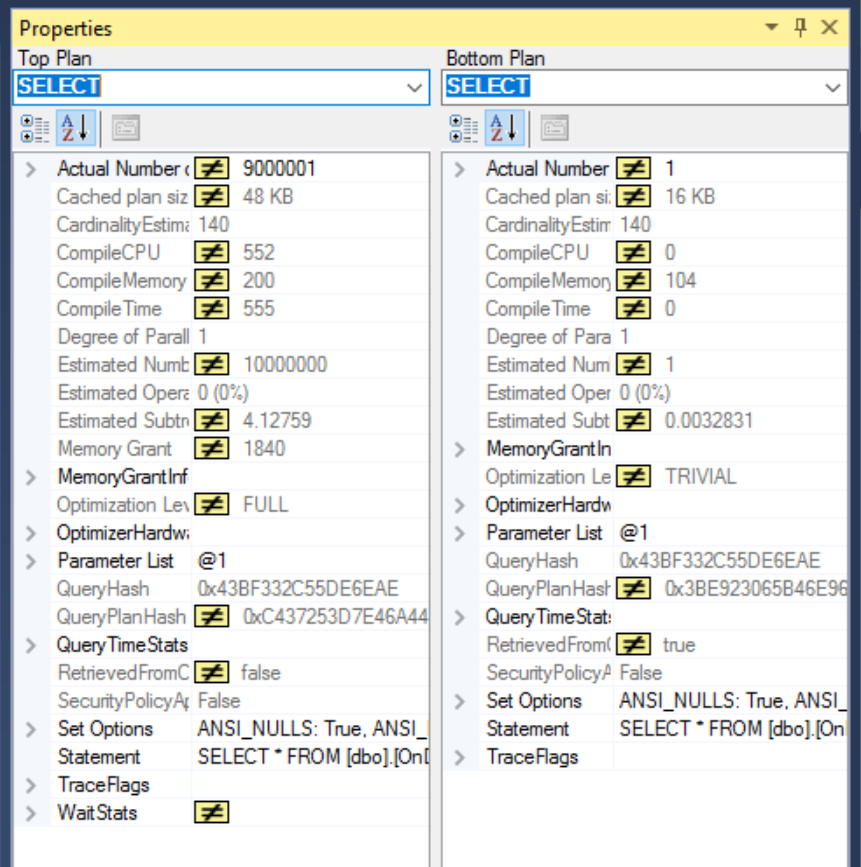
These details allow us to notice the vastly different number of rows that are returned by each query, and shows how the access plans for each differ in a way that quickly pinpoints the differences.
[…] Hannah Vernon looks at plan comparison in SQL Server Management Studio: […]